Tuning and Analysis Utilities (TAU)
The University of Oregon’s TAU is an open-source portable profiling and tracing toolkit for the performance analysis of parallel programs written in Fortran, C, C++, UPC, Java, Python and other languages. The instrumentation of programs can be done by binary code rewriting, manual compiler directives, or automatic source code transformation. TAU can support many parallel programming interfaces, including MPI, OpenMP, pthreads, and ROCm. TAU includes paraprof which is a profile visualization tool, and generated execution traces can be displayed by the Vampir, Paraver or JumpShot (included) visualization tools.
Enabling TAU at OLCF
On most OLCF systems TAU is available as a module. Note: since TAU can work by preloading and intercepting function calls, it is incompatible with other software that works in a similar way (e.g. darshan-runtime).
module unload darshan-runtime  # incompatible with TAU
module avail tau      # list available TAU modules
# On Apr 2025: tau/2.34-gpu-mpi-omp    tau/2.34-gpu-omp    tau/2.34-mpi-omp (L)    tau/2.34-omp (D)
module load tau       # load the default TAU module (tau/2.34-omp)
env | grep TAU        # display TAU settings
The TAU environment variables show the location of the TAU installation and the default TAU_MAKEFILE. TAU compiler wrappers use the TAU_MAKEFILE for capabilities to be supported while instrumenting and compiling code.
Profile and trace using “tau_exec exe”
The simplest way to profile with TAU is to prepend tau_exec to an
executable. There is no need to recompile code with this approach. The
tau_exec preloads a library that instruments specific functions that are
intercepted at runtime. This method uses statistical sampling to estimate
time spent in functions. Depending on how TAU is configured, intercepted
functions can include MPI, OpenMP, pthreads, GPU libraries, and others.
module unload darshan-runtime  # incompatible with TAU
module load tau

# Copy from the TAU installation
rsync -va $OLCF_TAU_ROOT/examples/taututorial ./taututorial
cd ./taututorial

# This tutorial is a Pi calculation with MPI support.
# Use CC (C++) to compile (Note: not using TAU wrappers)
# Use the -include flag to add missing headers (if needed)
CC computePi.cpp -o computePi_CC --include "climits"
Using tau_exec simplifies profiling and tracing code, but there is a lot of
information missing. This approach cannot instrument user source code so much
of the user context is missing.
Profiling the execution
The tau_exec tool will profile the code by default, tracking the time spent
in various parts of the code. The generated profile data can be viewed using a
command line tool pprof or the graphical interface paraprof. Using the
graphical viewer may require X-display forwarding (e.g. ssh -X <host>, see
https://docs.olcf.ornl.gov/connecting/index.html#x11-forwarding for details).
# Make output directory (default is the current dir)
mkdir profiledir
export PROFILEDIR=profiledir
export TAU_PROFILE=1

# Allocate 1 node and run 4 tasks, collect profile (default)
srun -A <ACCOUNT> -N 1 -t 5 -n 4 tau_exec ./computePi_CC

# Other tau_exec options
# tau_exec -ebs             # event-based-sampling
# tau_exec -T serial,rocm   # -T <option> tau options

# To run the Paraprof profiler (included with TAU)
pprof $PROFILEDIR      # command line view
paraprof $PROFILEDIR   # graphical, requires X-forwarding/X-display
# Note: Oct 2024 for Mac XQuartx uses 'paraprof -fix-xquartz'
# X-forwarding: https://docs.olcf.ornl.gov/connecting/index.html#x11-forwarding
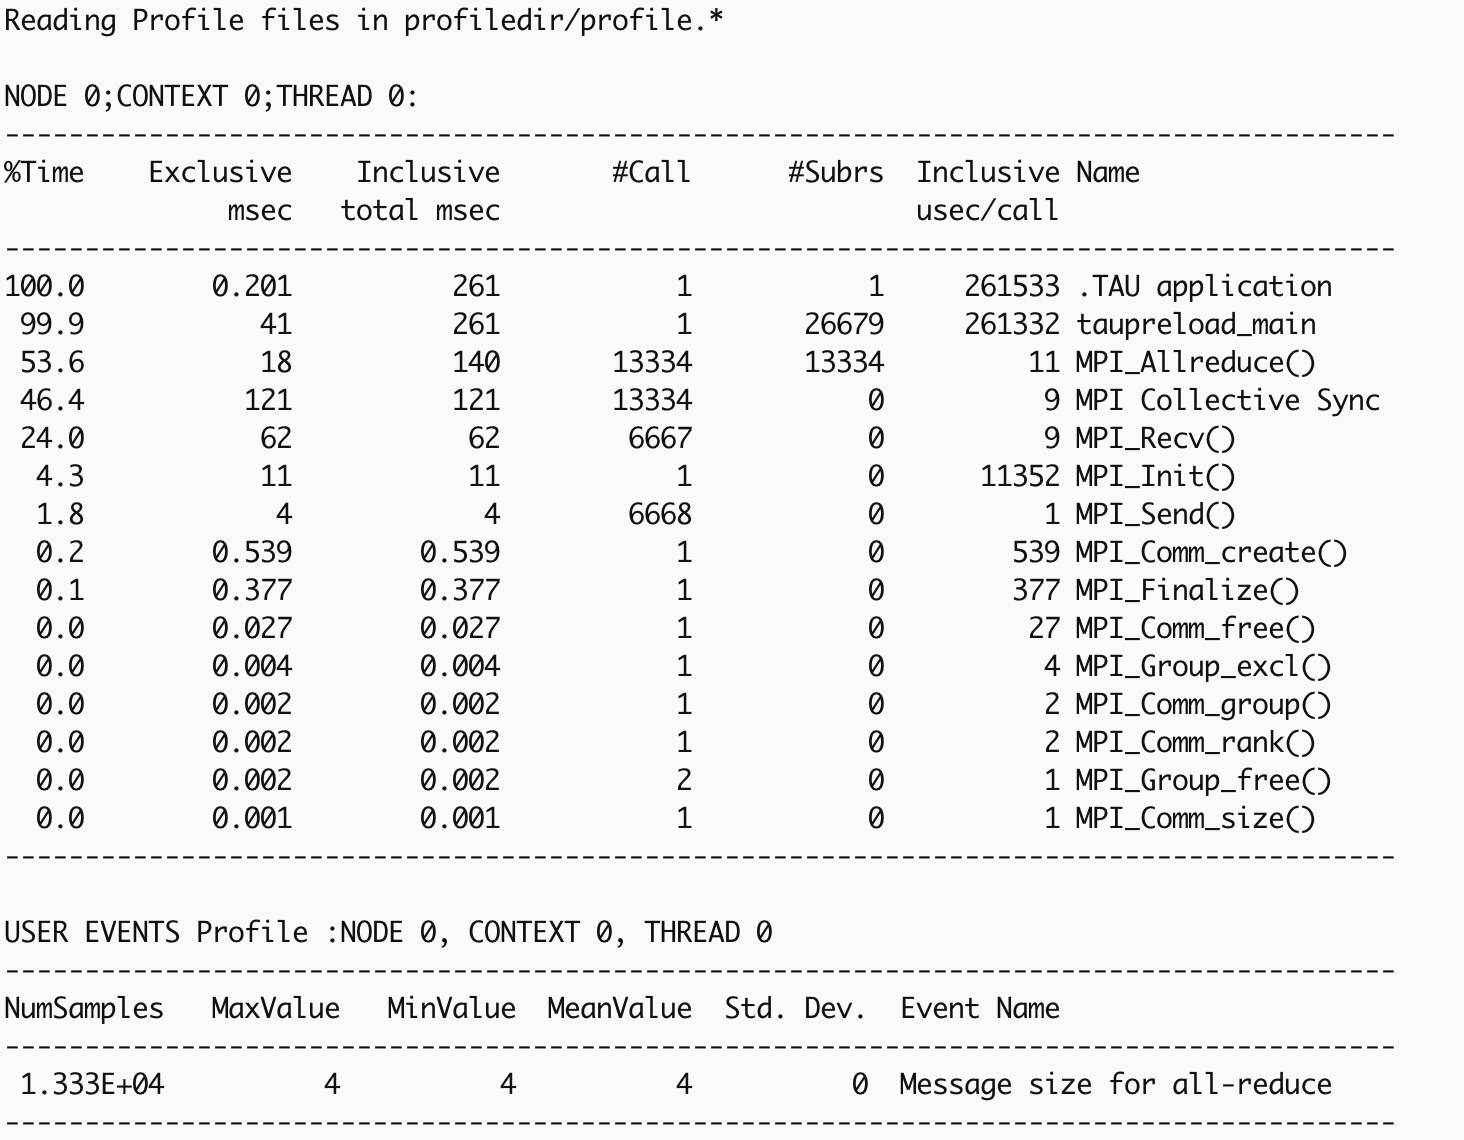
This textual output generated by pprof shows the time profile of the
execution. The execution used multiple MPI processes, and the function summary
(mean) shows the average time profile of the processes. The MPI_Allreduce
and MPI_Recv functions can be seen as major time consumers.
pprof $PROFILEDIR
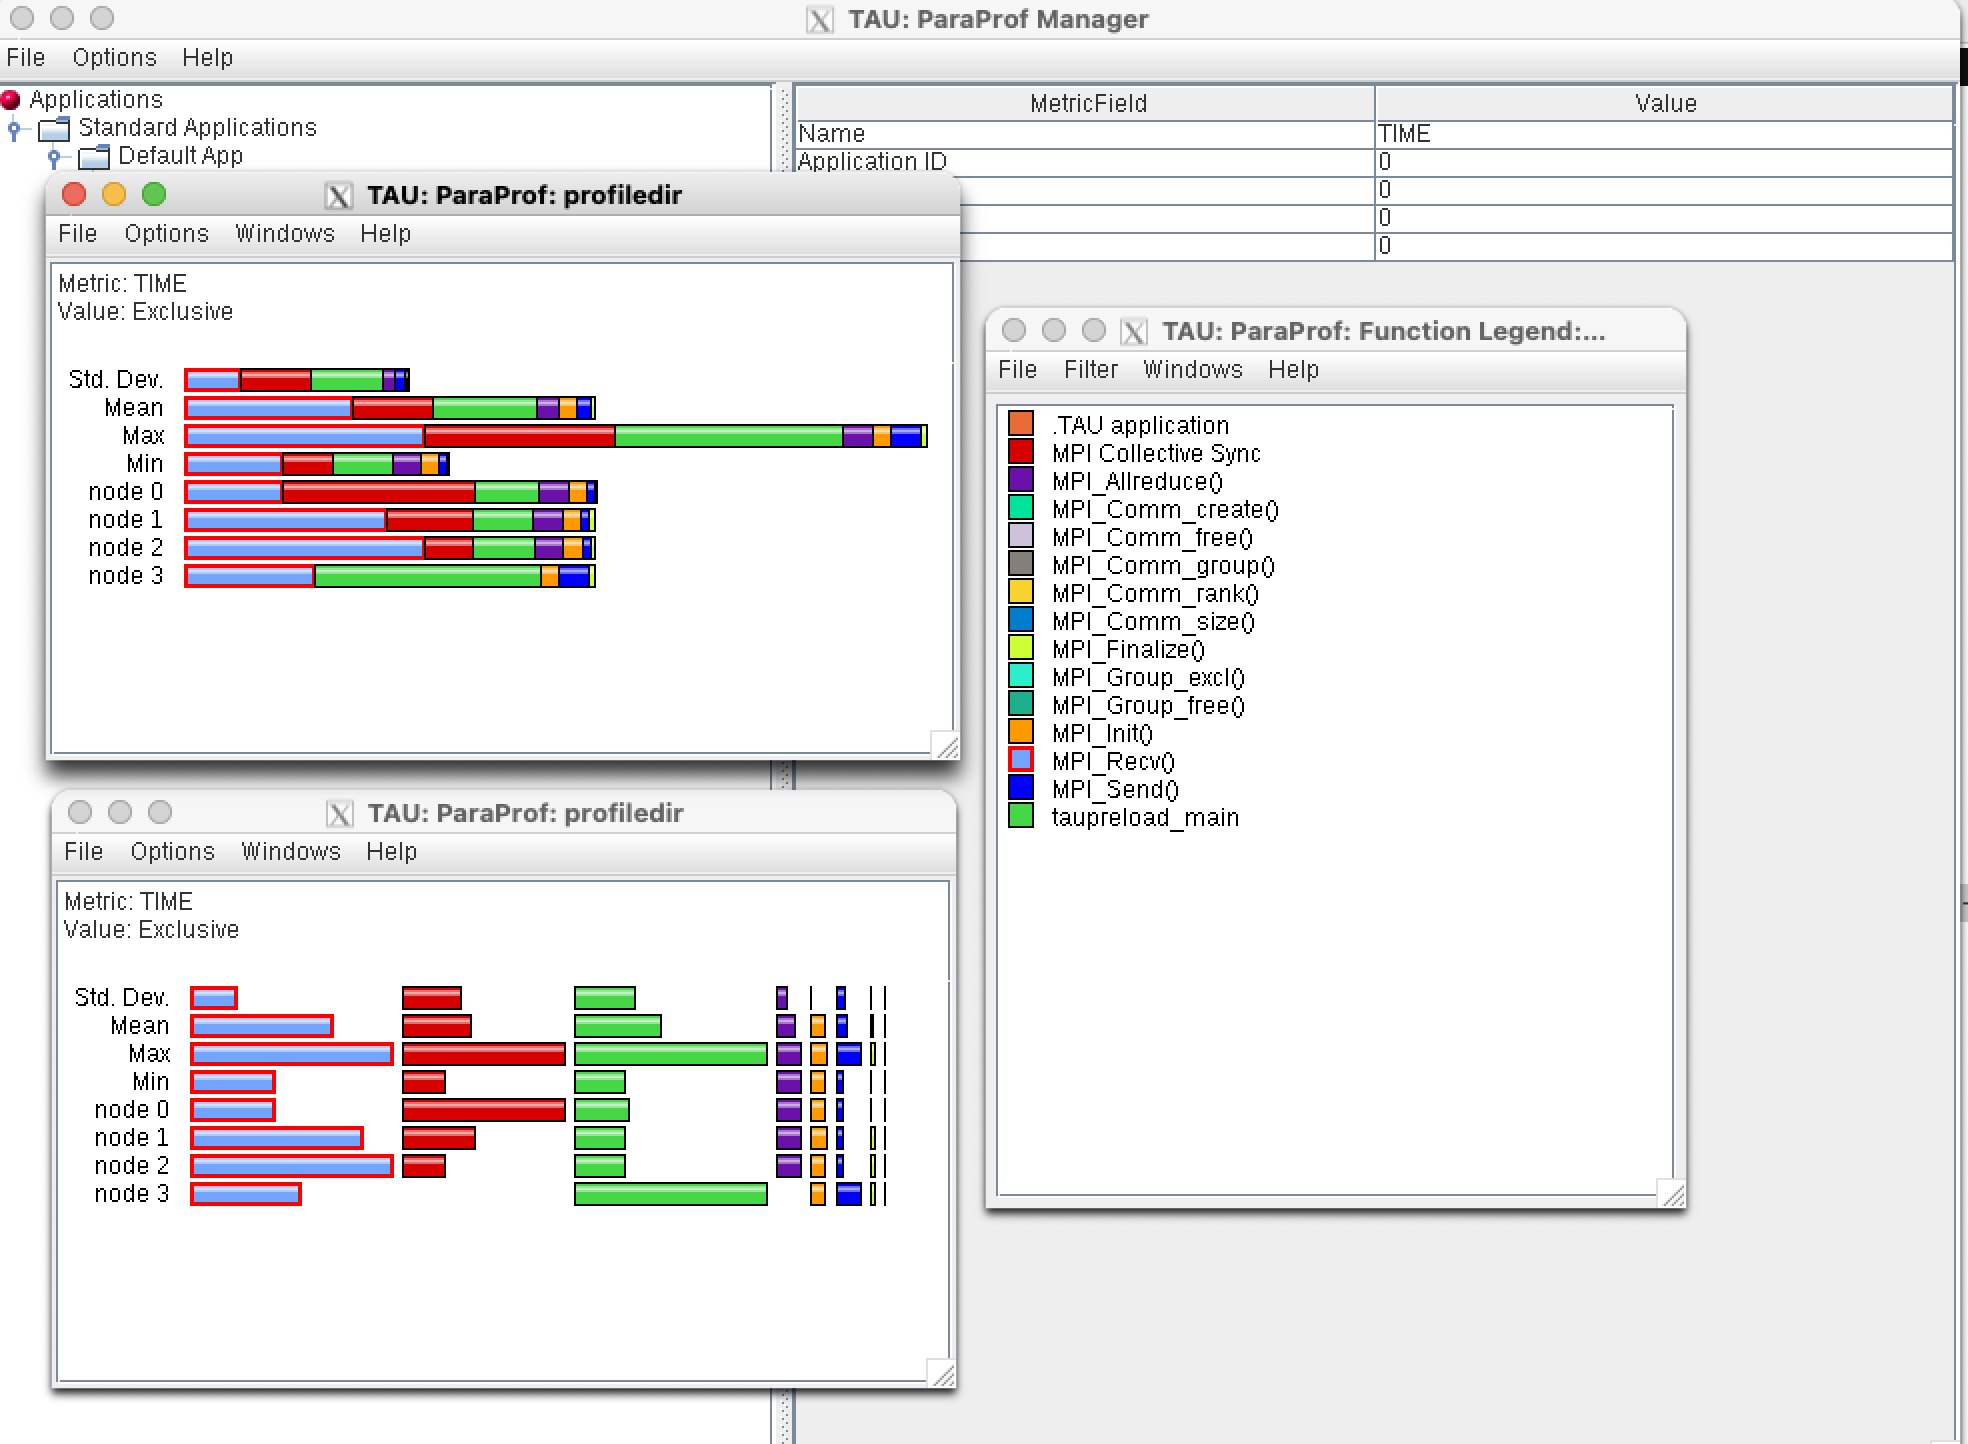
The profile can be viewed using the graphical paraprof tool, which can also
produce a number of other views of the execution (not discussed here). The
basic TIME view (top left) shows as a stacked bar, a simple switch to unstack
the bars (bottom left) can show load imbalances in functions.
paraprof $PROFILEDIR
Tracing the execution
The tau_exec tool can also generate a trace file for the execution and the
generated trace can be displayed using the included Jumpshot trace visualization
tool. Note: TAU can also create traces for Chrome/Perfetto (json) and for
Vampir (otf2) visualization.
# Make output directory (default is the current dir)
mkdir tracedir
export TRACEDIR=tracedir

# Allocate 1 node and run 2 tasks, collect trace
export TAU_TRACE=1 TAU_PROFILE=0
srun -A <ACCOUNT> -N 1 -t 5 -n 2 tau_exec ./computePi_CC
# Note: Still using the un-instrumented executable

# Post process trace files
cd ${TRACEDIR}
rm -f tau.trc tau.edf         # remove old files
tau_treemerge.pl              # merge traces for tau
tau2slog2 tau.trc tau.edf -o yourprogram.slog2
# Launch the (included) trace viewer (requires X-forwarding)
# The slog2 trace can be scp'ed to your local machine to avoid X-forwarding
jumpshot yourprogram.slog2
# The output from jumpshot will be shown in the next section
TAU traces can be viewed by Chrome/Perfetto by converting them to json or in
Vampir by converting to otf2. Information about using the Vampir viewer at
OLCF can be found at https://docs.olcf.ornl.gov/software/profiling/Vampir.html.
# Convert trace to json for Chrome/Perfetto
tau_trace2json tau.trc tau.edf –chrome –ignoreatomic –o app.json
# View using chrome://tracing (Load -> app.json)
# Or use https://ui.perfetto.dev/ and load the trace

# Convert trace to otf2 for Vampir
export TAU_TRACE=1; export TAU_TRACE_FORMAT=otf2
mpirun -np 64 tau_exec ./a.out; vampir traces.otf2 &
# Information about using the Vampir viewer at OLCF
# https://docs.olcf.ornl.gov/software/profiling/Vampir.html
Automatic source instrumentation using compiler wrappers
TAU compiler wrapper scripts (tau_cc.sh, tau_cxx.sh, tau_f90.sh) can be used to build code, automatically adding timer start/stop calls around code-regions (this works on a copy and does not change the original code). The Program Database Toolkit (PDT) is used to parse the source code and add this instrumentation. A selective filter file can be used to reduce overhead and specify areas for instrumentation.
For C: use the TAU wrapper
tau_cc.shFor C++: use the TAU wrapper
tau_cxx.shFor Fortran: use the TAU wrapper
tau_f90.sh/tau_f77.sh
module unload darshan-runtime  # incompatible with TAU
# NOTE: The tau mpi-omp module is used here
module load tau/2.34-mpi-omp
# Copy example from the TAU installation
rsync -va $OLCF_TAU_ROOT/examples/taututorial ./taututorial
cd ./taututorial

# See the current/default TAU support
echo $TAU_MAKEFILE
# To change the TAU support, use other Makefiles
# setenv TAU_MAKEFILE $OLCF_TAU_ROOT/lib/Makefile<other-support>

# Use TAU wrappers to compile
# Use the -include flag to add missing headers (if needed)
tau_cxx.sh computePi.cpp -o computePi_taucxx -include "climits"

# To keep intermediate files, or turn on the verbose mode or use a selective
# instrumentation file select.tau, set TAU_OPTIONS
# setenv TAU_OPTIONS  '-optKeepFiles -optVerbose -optTauSelectFile="select.tau"'
Profiling and tracing for code execution follow the earlier example.
# Make output directories
mkdir profiledir tracedir
export PROFILEDIR=profiledir TRACEDIR=tracedir

# Collect profile, trace in the same run
export TAU_TRACE=1 TAU_PROFILE=1

# Allocate 1 node for 5 min and run 2 tasks
# Note: This is not using tau_exec
srun -A <ACCOUNT> -N 1 -t 5 -n 2 ./computePi_taucxx

# View profile using command line pprof
pprof   # Uses the PROFILEDIR var to find data
# Could also use GUI: paraprof $PROFILEDIR
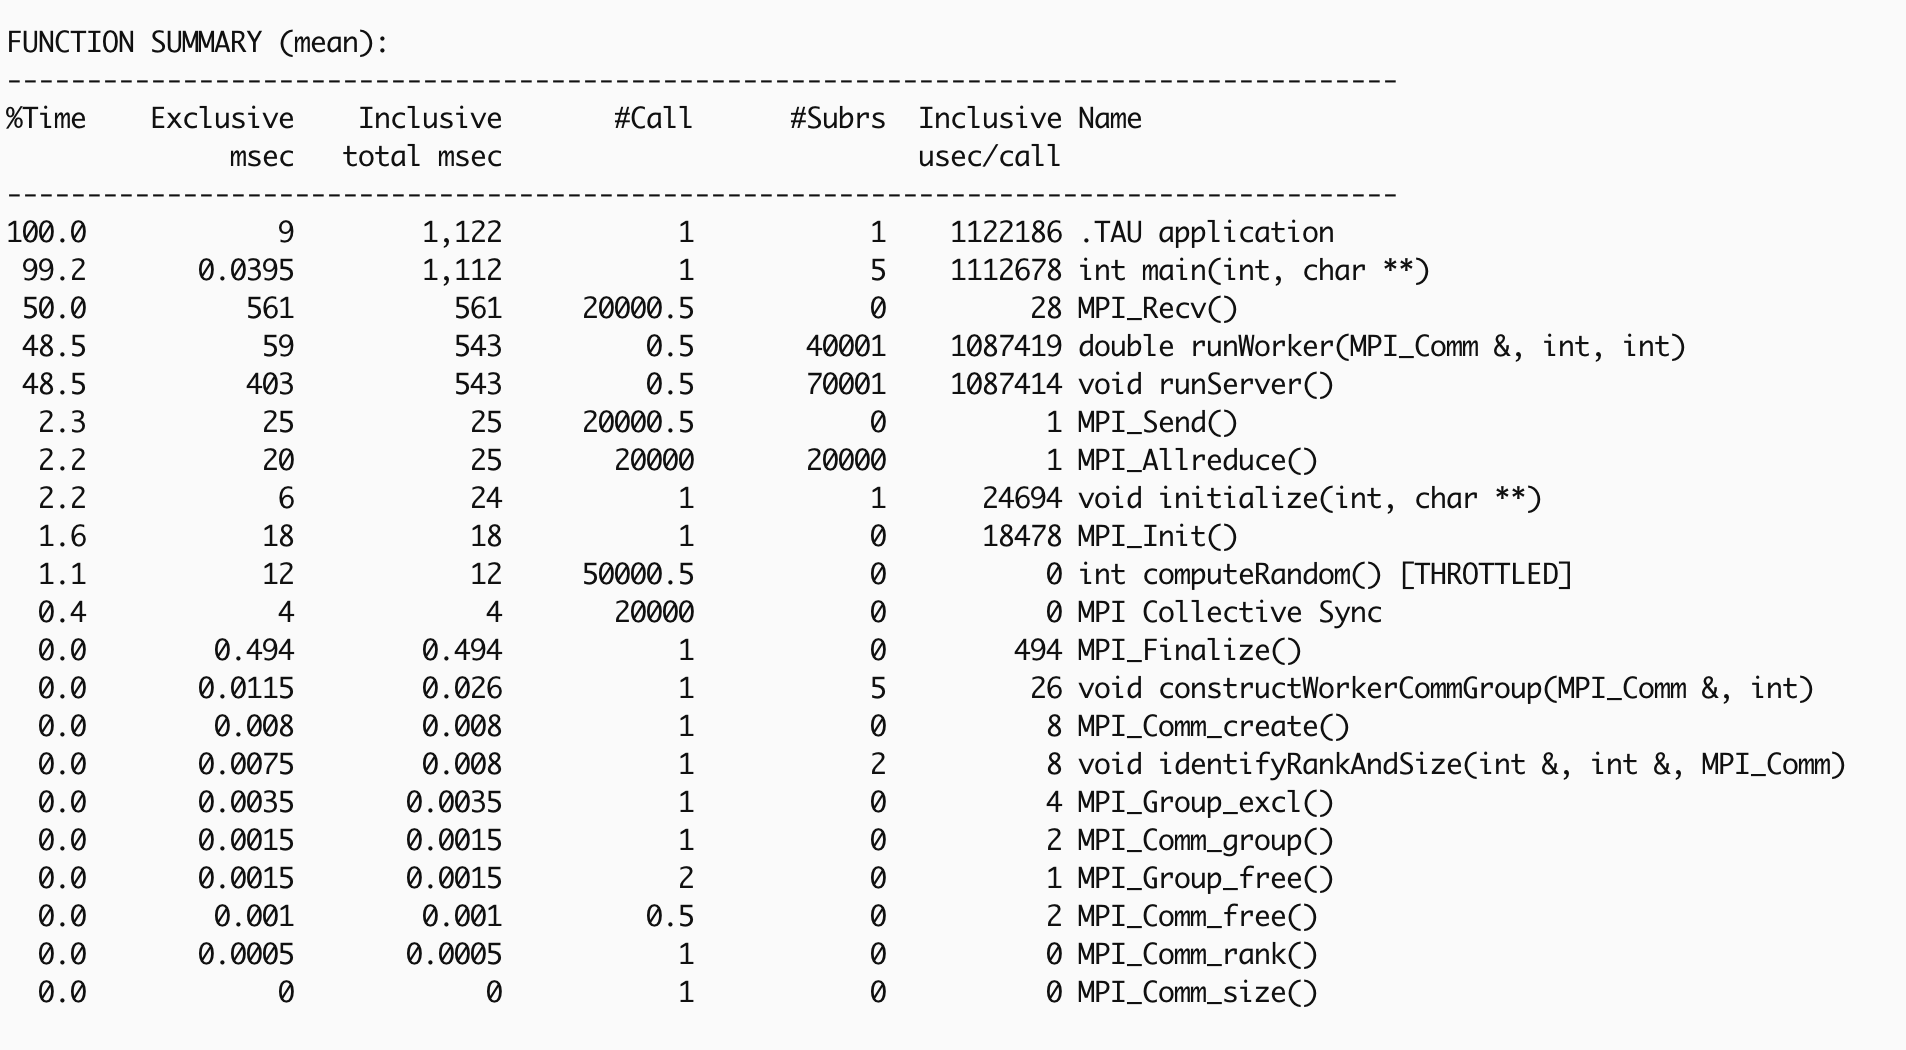
The generated profile now has information about the users code.
pprof $PROFILEDIR
# View trace using Jumpshot
cd ${TRACEDIR}
tau_treemerge.pl
tau2slog2 tau.trc tau.edf -o yourprogram.slog2
# Launch the (included) trace viewer (requires X-forwarding)
# Or copy the slog2 file and use a local jumpshot tool
jumpshot yourprogram.slog2
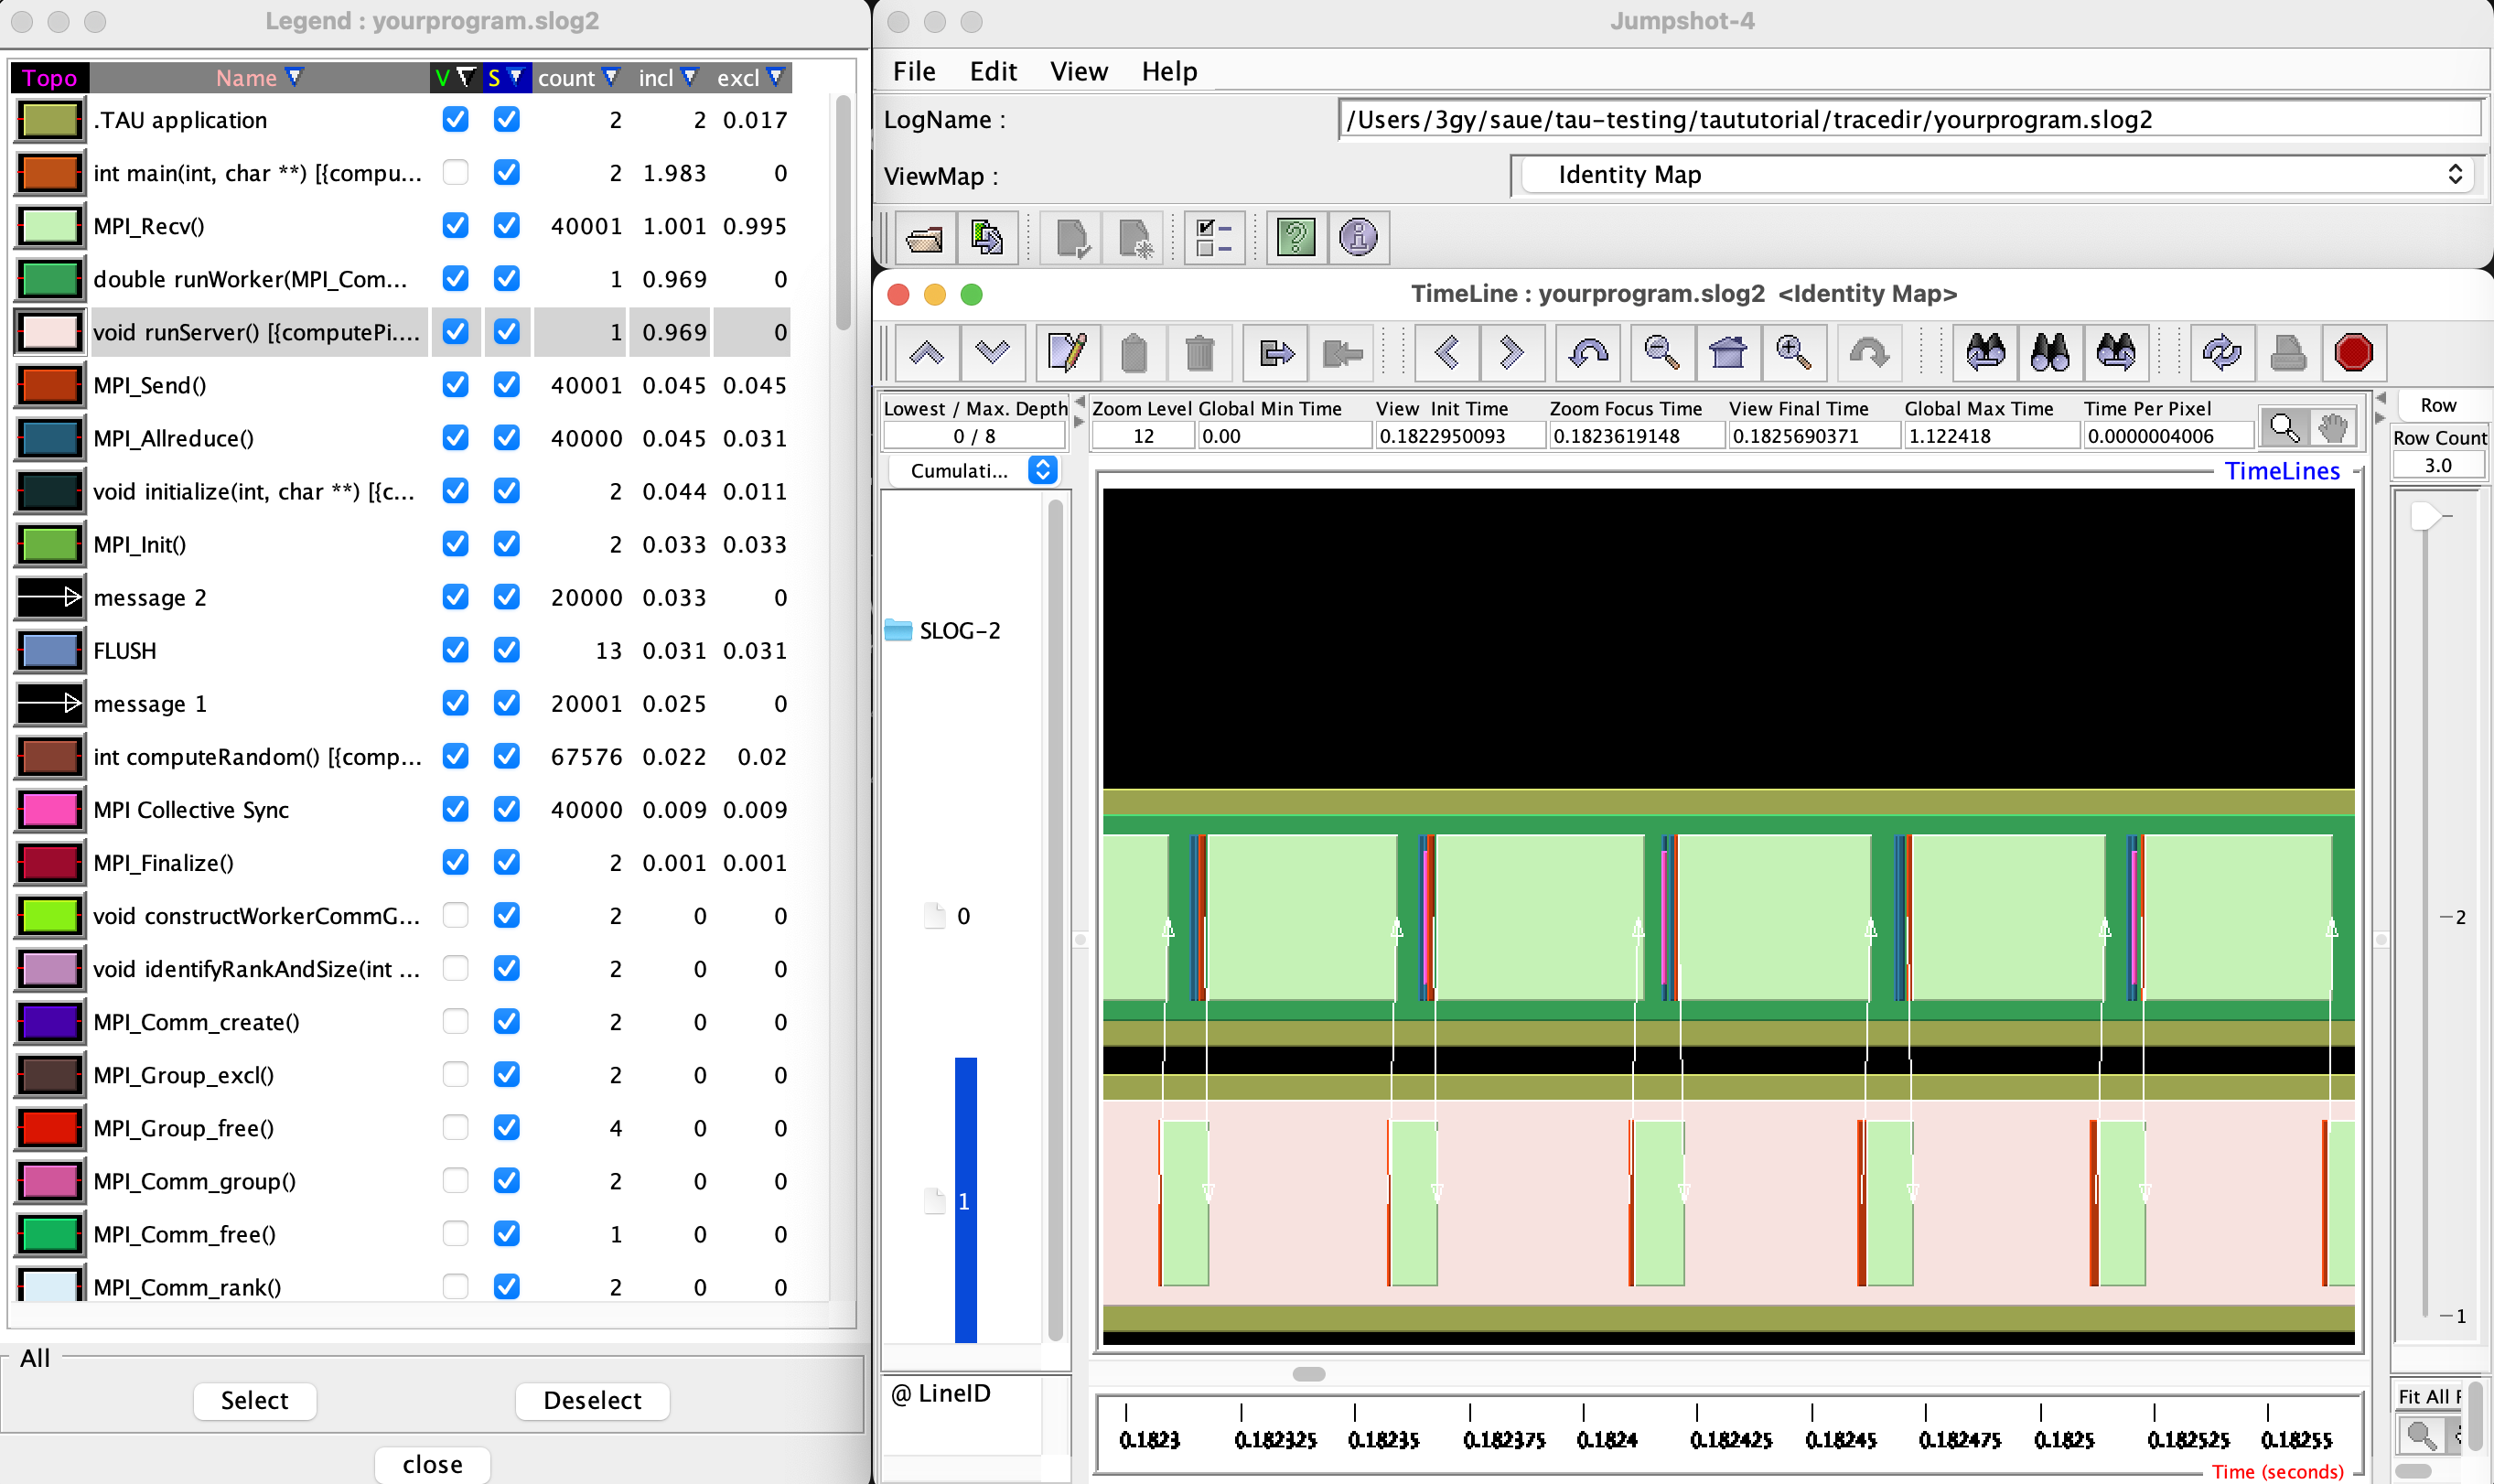
The Jumpshot trace view here is restricted to the most time consuming functions, and it can be clearly seen how the MPI_Recv is waiting in the two processes. The user code functions can be seen in context with the automatic instrumentation.
jumpshot yourprogram.slog2
Selective Instrumentation
A program can have a number of smallar functions that do not take a significant amount of execution time but are called repeatedly. These smaller functions can make the profile complicated without adding any value to the profiling analysis. TAU can selectively exclude functions, annotate (outer) loops, and add a few other code annotations.
A selective instumentation file can be used with the flag
-tau_options=-optTauSelectFile=<file> or by setting the environment variable
export TAU_OPTIONS='-optTauSelectFile="<file>"'. This can work very well
when used in combination with the TAU compiler wrappers to instrument your code.
The following example is taken with minor changes from the TAU manual.
# Wildcards for routine names are specified with the # mark (because * symbols
# show up in routine signatures.) The # mark is unfortunately the comment
# character as well, so to specify a leading wildcard, place the entry in quotes.

# Wildcards for file names are specified with * symbols.

#Tell tau to not profile these functions
BEGIN_EXCLUDE_LIST
void quicksort(int *, int, int)
# The next line excludes all functions beginning with "sort_" and having
# arguments "int *"
void sort_#(int *)
END_EXCLUDE_LIST

#Exclude these files from profiling
BEGIN_FILE_EXCLUDE_LIST
*.so
END_FILE_EXCLUDE_LIST


#Instrument specific loops or other things
BEGIN_INSTRUMENT_SECTION
# instrument all the outer loops in this routine
loops file="loop_test.cpp" routine="multiply"
# tracks memory allocations/deallocations as well as potential leaks
memory file="foo.f90" routine="INIT"
# tracks the size of read, write and print statements in this routine
io file="foo.f90" routine="RINB"
# A dynamic phase will break up the profile into phase where
# each events is recorded according to what phase of the application
# in which it occured.
dynamic phase name="foo1_bar" file="foo.c" line=26 to line=27
END_INSTRUMENT_SECTION
The dynamic phase at the bottom of the INSTRUMENT_SECTION puts TAU
instrumentation around foo.c line 26-29, and adds to the profile each time
the run enters and exits those lines. This can be very flexible but may lead to
unexpected overhead, so use with care. A static phase option accumulates
data for a region into a single record, so may be a better option for certain
cases.
Manual source instrumentation
TAU provides a rich set of functions that can be used to instrument code at very specific locations. Discussion of manual code instrumentation is outside the scope of this guide, but the TAU documentation gives details of all the functions available to instrument your code.
Run-Time Environment Variables
The following TAU environment variables may be useful in job submission scripts.
Variable | Default | Description |
||
|---|---|---|
TAU_TRACE | 0 | Setting to 1 turns on tracing |
||
TAU_CALLPATH |
0 |
Setting to 1 turns on callpath profiling |
TAU_TRACK_MEMORY_LEAKS |
0 |
Setting to 1 turns on leak detection |
TAU_TRACK_HEAP |
0 |
Setting to 1 turns on heap memory routine entry/exit |
TAU_CALLPATH_DEPTH |
2 |
Specifies depth of callpath |
TAU_TRACK_IO_PARAMS |
0 |
Setting 1 with |
TAU_SAMPLING |
1 |
Generates sample based profiles |
TAU_COMM_MATRIX |
0 |
Setting to 1 generates communication matrix |
TAU_THROTTLE |
1 |
Setting to 0 turns off throttling, by default removes overhead |
TAU_THROTTLE_NUMCALLS |
100000 |
Number of calls before testing throttling |
TAU_THROTTLE_PERCALL |
10 |
If a routine is called more than 100000 times and it takes less than 10 usec of inclusive time, throttle it |
TAU_COMPENSATE |
10 |
Setting to 1 enables runtime compensation of instrumentation overhead |
TAU_PROFILE_FORMAT |
Profile |
Setting to “merged” generates a single file, “snapshot” generates a snapshot per thread |
TAU_METRICS |
TIME |
Setting to a comma separated list (TIME:PAPI_TOT_INS) |
Compile-Time Environment Variables
Environment variables to be used during compilation through the environment
variable TAU_OPTIONS. For example, export TAU_OPTIONS='-optKeepFiles
-optVerbose -optTauSelectFile="select.tau"'
Variable |
Description |
|---|---|
-optVerbose |
Turn on verbose debugging messages |
-optCompInst |
Use compiler based instrumentation |
-optNoCompInst |
Do not revert to compiler instrumentation if source instrumentation fails |
-optTrackIO |
Wrap POSIX I/O call and calculate vol/bw of I/O operations |
-optKeepFiles |
Do not remove .pdb and .inst.* files |
-optPreProcess |
Preprocess Fortran sources before instrumentation |
-optTauSelectFile=”<file>” |
Specify selective instrumentation file for tau_instrumentor |
-optTwauWrapFile=”<file>” |
Specify path to link_options.tau generated by tau_gen_wrapper |
-optHeaderInst |
Enable instrumentation of headers |
-optLinking=”” |
Options passed to the linker |
-optCompile=”” |
Options passed to the compiler |
-optPdtF95Opts=”” |
Add options to the Fortran parser in PDT |
-optPdtF95Reset=”” |
Reset options for Fortran parser in PDT |
-optPdtCOpts=”” |
Options for C parser in PDT |
-optPdtCXXOpts=”” |
Options for C++ parser in PDT |
References
TAU has many capabilites that are not covered here, e.g. memory tracking, call path profiling, python support, MPI, Kokkos, OpenACC, OpenMP, CUDA, HIP, OneAPI support. Please see the ‘TAU on Crusher’ presentation listed below for some idea of the capabilites on similar OLCF systems.
Main TAU website: https://www.cs.uoregon.edu/research/tau/home.php
TAU on Crusher (pre-Frontier OLCF system), March 2022, Sameer Shende (U Oregon), http://www.nic.uoregon.edu/~khuck/RAPIDS/TAUonCrusher.pdf
TAU Performance System, June 2024, Sameer Shende (U Oregon), https://www.vi-hps.org/cms/upload/material/tw45/TAU_TW45.pdf
TAU training on the OLCF Training Archive https://docs.olcf.ornl.gov/training/training_archive.html
Date |
Title |
Speaker |
Event |
Presentation |
|---|---|---|---|---|
2020-07-28 |
TAU Performance Analysis |
Sameer Shende |
||
2019-08-08 |
Performance Analysis with TAU |
George Makomanolis (OLCF) |
||
2019-08-07 |
Intro to TAU |
George Makomanolis (OLCF) |