
Linaro
Overview
Performance optimization is a critical task in efficient high-performance computing (HPC), since the cost of bottlenecks increases with growing system size. Linaro Forge MAP is a scalable statistical performance profiler designed for parallel applications. It helps identify application hot spots and performance bottlenecks by periodically sampling the program during execution and associating the collected data with source-code locations. MAP provides a unified view of application performance, including computation, MPI communication, OpenMP activity, I/O, memory usage, and accelerator activity such as AMD ROCm. Its interactive displays help users understand how performance varies across processes, threads, source-code regions, and the execution timeline.
MAP uses statistical sampling to collect performance data with relatively low overhead. It can therefore be used to profile large-scale applications and investigate issues such as load imbalance, excessive communication, synchronization, memory behavior, and inefficient computation. For the most useful source-level information, applications should generally be compiled with debugging information.
Linaro Forge MAP is part of the Linaro Forge suite, which also includes the DDT parallel debugger. MAP can be launched through the Forge graphical interface and used with batch-scheduled applications on HPC systems. The resulting performance report can be interactively explored to compare processes and threads, examine time spent in different application regions, and locate performance-critical lines of source code.
The instructions below outline how to access and display the Linaro Forge MAP GUI for OLCF systems, but do not cover detailed usage of MAP itself. Please refer to the Linaro Forge MAP documentation for information about configuring and running MAP, interpreting its reports, and using its analysis features. Additionally, Linaro Performance Reports are briefly discussed.
Usage
Performance Reports
Linaro offers two methods of gathering code performance data. The first and simplest method is by generating a performance report. The performance reports provide a quick summary of the following key aspects of your code in text or html format:
Computation - scalar operations, vector operations, memory access, etc.
Memory - peak and mean memory utilization
I/O - cumulative time in reads/writes
Communication (MPI) - MPI communication cost for point-to-point and collective operations
Threads - time spent in computation and synchronization of multi-threaded code
OpenMP - time spent in OpenMP regions
Accelerators - time spent executing kernels on the GPU and GPU memory utilization metrics
Additionally, the performance report offers some advice as to where you should optimize your code if you’re seeing performance bottlenecks. For more information on performance reports please see the documentation here Interpret performance reports.
To generate a performance report for your code on Frontier, simply load an appropriate linaro-forge module and preface your code with perf-report:
module unload darshan-runtime
module load linaro-forge
perf-report srun -N $SLURM_NNODES --ntasks-per-node 8 -c 7 --gpus-per-task 1 --gpu-bind=closest mpi_executable
Tip
To generate a performance report for non-MPI code (e.g., Python) use the --nompi flag.
Linaro MAP
The second, more informative method of gathering profiling data is with the MAP tool. MAP profiles can be viewed interactively by using Linaro’s remote client or obtained asynchronously after a job completes.
Remote clients are available for Windows, Mac, and Linux, and can be used without an additional license. See the Linaro Forge page for more information.
To setup the remote client on Frontier, please see Client Setup and Usage. Once setup, you can preface launching your code with map --connect much like using DDT to visualize a code profile interactively.
It may not always be feasible to have an interactive code profiling session. Therefore, a .map file can be generated for viewing your code profile asynchronously by prefacing your code
with map --profile instead.
module unload darshan-runtime
module load linaro-forge

# For interactive profiling. NOTE: the remote client must be configured on Frontier and initialized on your local machine
map --connect srun -N $SLURM_NNODES --ntasks-per-node 8 -c 7 --gpus-per-task 1 --gpu-bind=closest mpi_executable

# For asynchronous profiling
map --profile srun -N $SLURM_NNODES --ntasks-per-node 8 -c 7 --gpus-per-task 1 --gpu-bind=closest mpi_executable
Loading a MAP Profile
You will need to download the .map file locally to view it in the Linaro Forge Client GUI. Additionally, to maximize MAP’s usefulness during asynchronous profiling, you should have a copy of
your source code in an accessible location locally. The MAP profile will likely point to the location of the source code on Frontier which will not be accessible during asynchronous
profiling.
Once your MAP file is downloaded:
Open the Linaro Forge Client
Navigate to the MAP tab
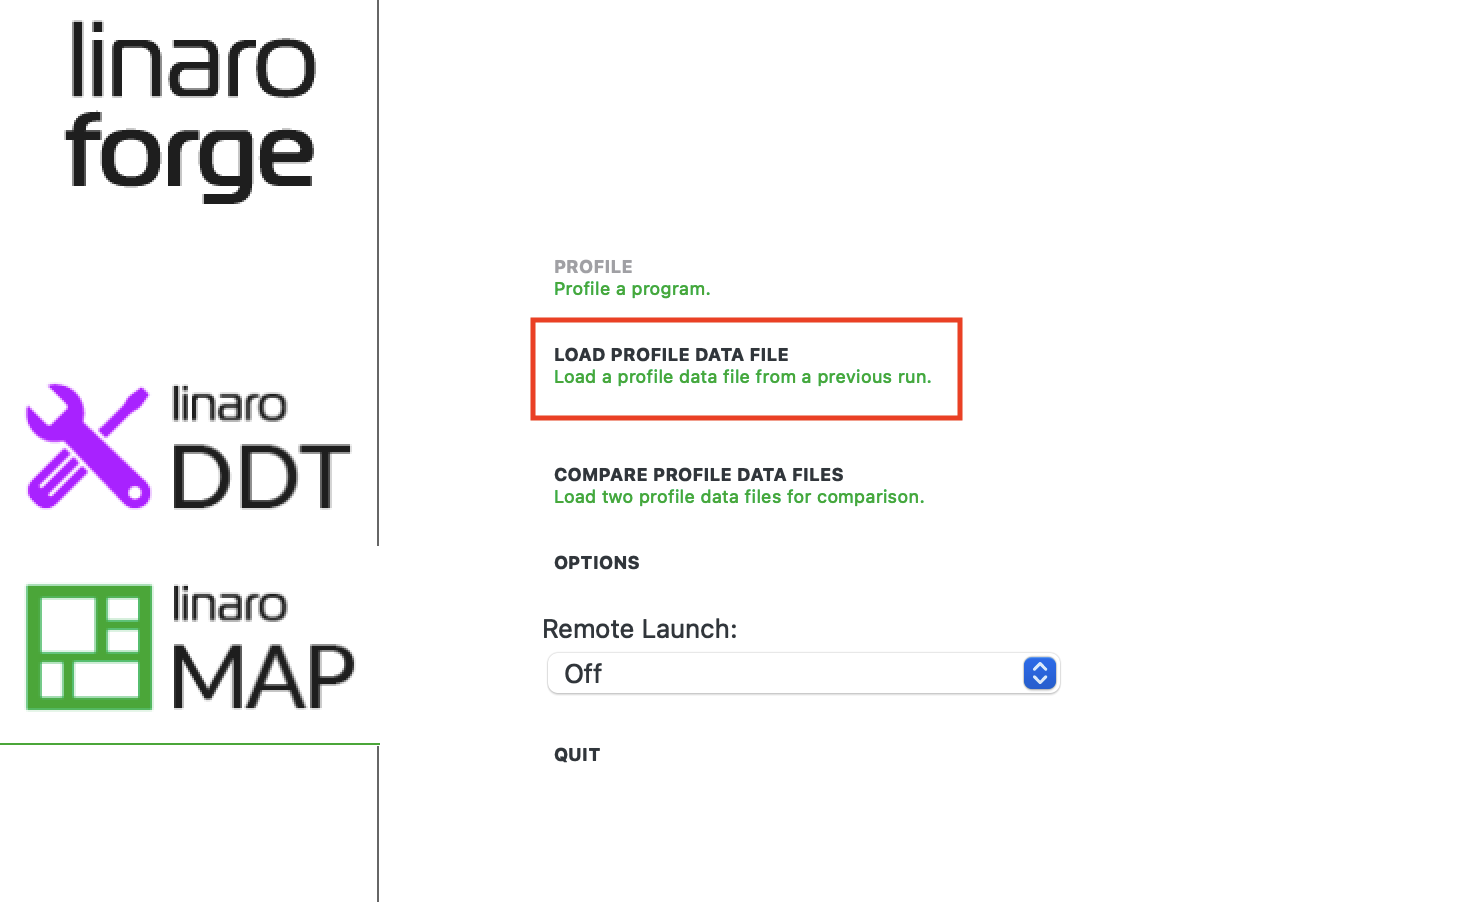
Press “LOAD PROFILE DATA FILE” and select the appropriate
*.mapfile.
If the source code region does not auto-populate, you may need to browse for its local location and add that to Linaro’s search path. To do this, navigate to the “Project Files” tab at the bottom of the client, right-click “Sources” -> “Add/view source directories…” -> Optional: “Scan for more files”
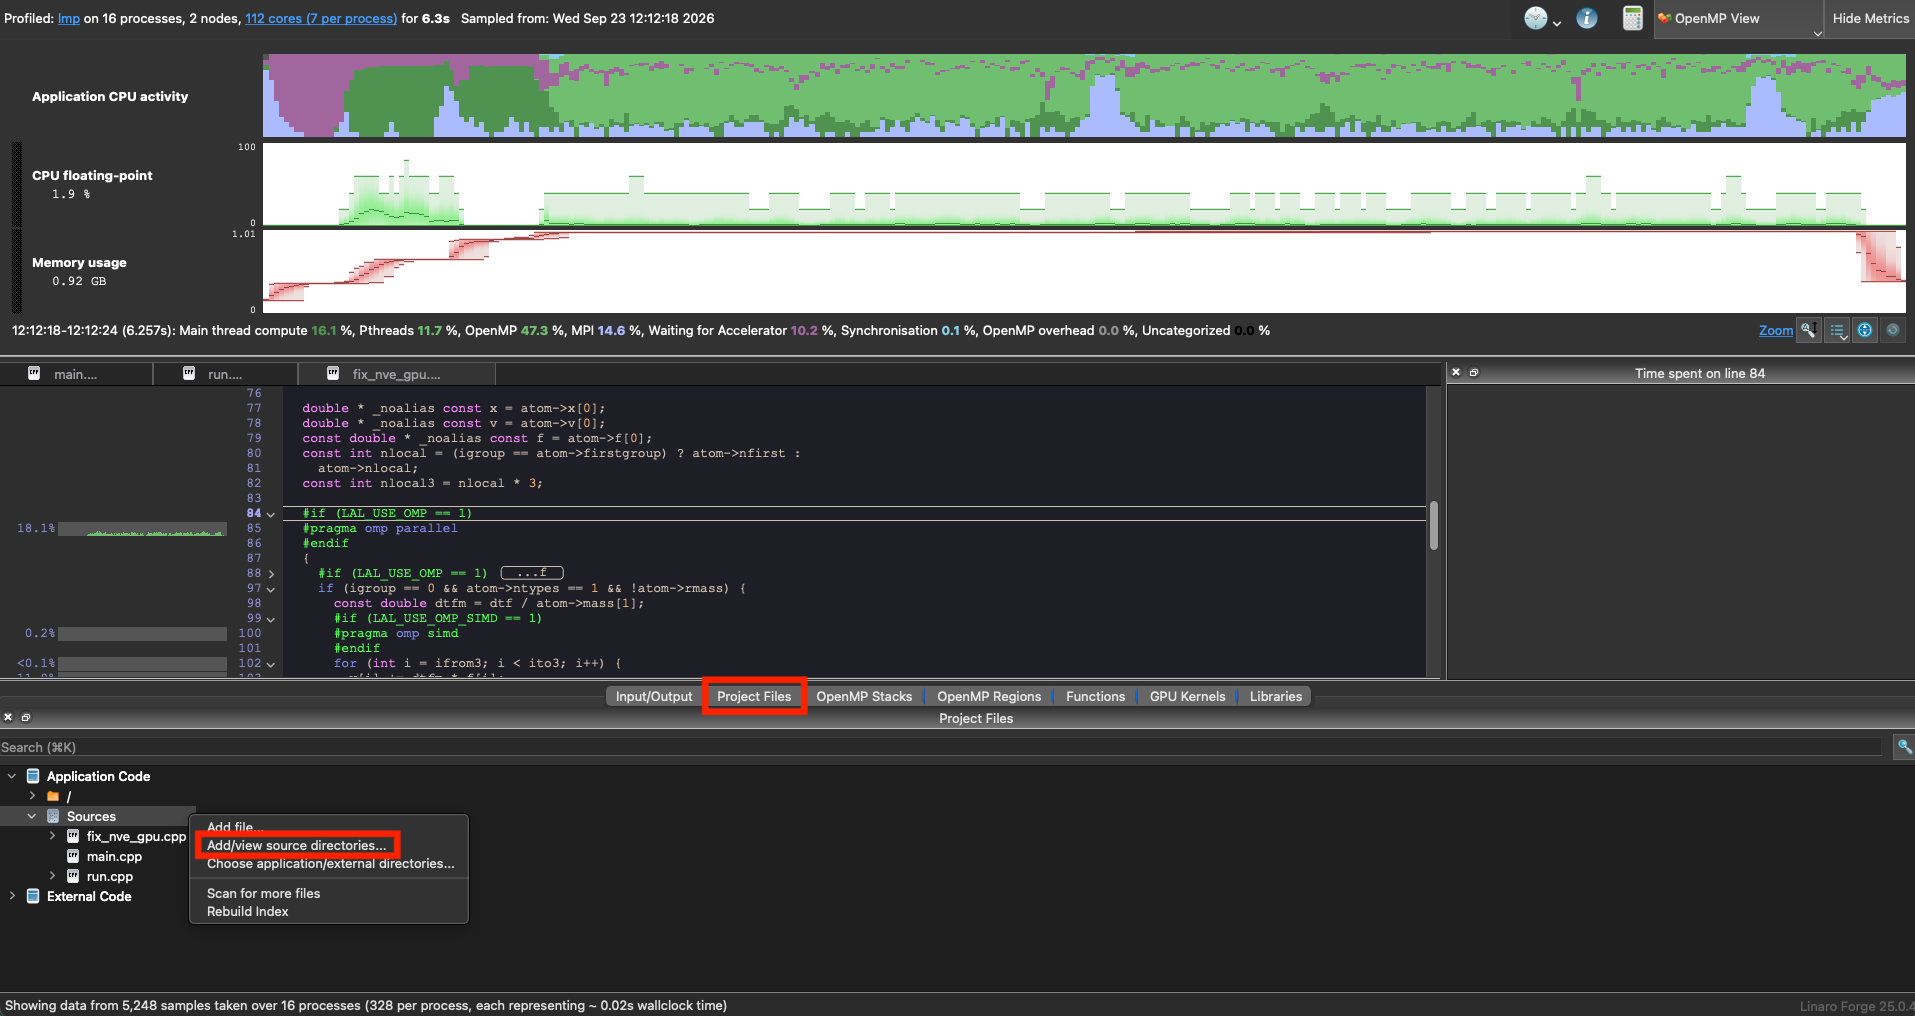
The MAP GUI enables users to quickly identify performance-critical areas of their application through preset metrics views. For example, navigate to the “Metrics” tab -> “Preset: AMD ROCm” to see regions of your code that was executing on Frontier GPUs. By highlighting a region in one of the metrics graphs, the bottom functions window will automatically change to the specific lines of code that executed in the highlighted region.
For more information on how to navigate the MAP interface and advanced profiling capabilities (e.g., including compiler remarks in the source code view), please refer to the official Linaro MAP documentation Getting Started with MAP.
Linaro Demo
You can watch the OLCF hosted training of Linaro DDT and MAP here: https://vimeo.com/970879852